TLDR A tale in 45 seconds
Health is the Sun Life landing page where people with workplace benefits check their coverage and follow up on claims. I was its designer through 2025 and took our redesign to the finish line. Much of the design was already in flight and the business had little appetite for change. I let testing make the case. Filtering claims failed badly, with only 21% of people able to do it. My redesign reached a 95% usability score. Everyone expected batch printing but no data showed anyone needed it. I designed a simpler download that scored 97% and shipped with tracking to settle the question. It launched in early 2026, and every main task we compared improved.
01 The Problem
Millions of people have health benefits with Sun Life, offered through their employer. When they come to our site, they land on the Health page (called Claims & Coverage when we built it) to check what they’re covered for, submit a claim, or follow up on one. Our signed-in site has three main areas: investments, health and insurance. As the landing page for health, it’s the front door to a site that had 6.8 million visits from 1.4 million unique visitors in just six months.
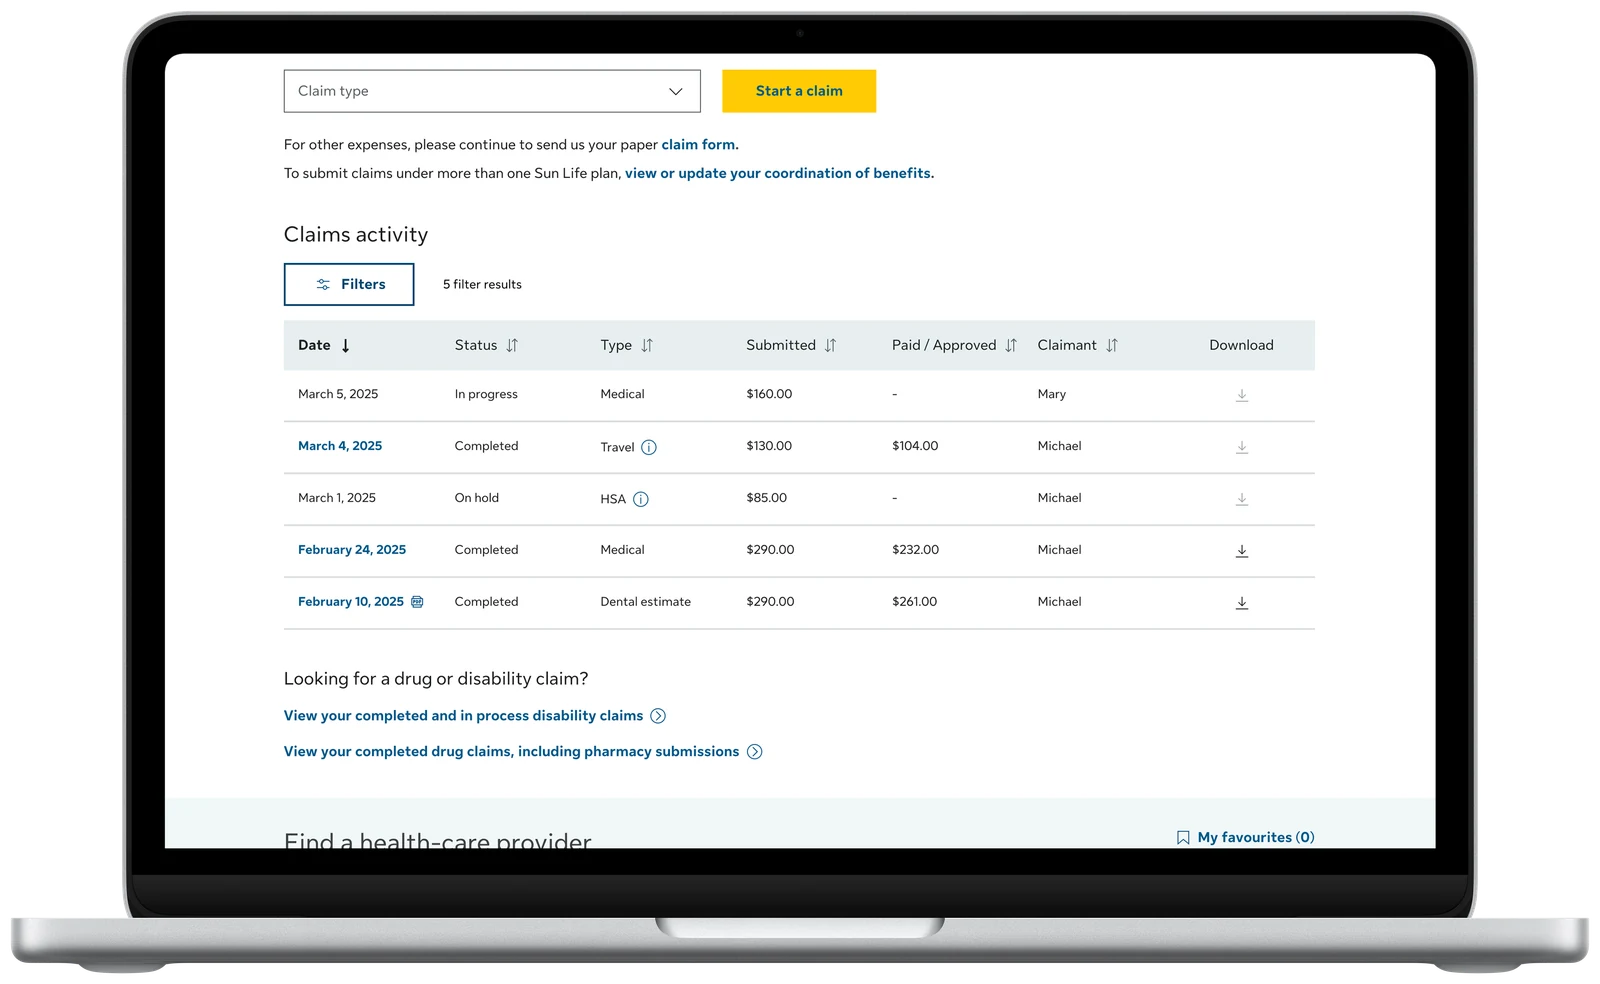
Of our three core journeys — looking up coverage, submitting a claim, and checking on a claim — the claims table is the part people come back to. In 90 days, the average person makes about 13 claims. But claims were split into separate tables by type, and the design I inherited copied a table more than ten years old into our new design system, batch printing and all.
Around it sat our oldest pages. Much of the benefits site was built in the early 2000s: hard to navigate, not accessible, and costly to maintain. 36% of people who rated it poorly blamed navigation. The new page had two jobs: give people a modern starting point and begin clearing a path through everything behind it.
02 My Role
I was the page’s designer for all of 2025, carrying it from a work-in-progress to a finished design. I ran every test in this story, wrote the cases for each change, and took the work through design review. A new designer then took it through edge cases and release, and it launched in early 2026 largely as I designed it.
When I joined, the work was already in flight and our business partners in health had little appetite for change. The old design felt safe because it was familiar even though we were redesigning the front door to health for the first time in years. So I leaned on evidence. I tested the details and retested my fixes. I checked the assumptions my gut said were weak. Then I built section-by-section boards in Figma that told the story so people could follow how each finding led to each change. If I was going to take over this huge project, I wanted every decision to be validated: one I could believe in and confidently share with others.
I had to win people over in order. First, our product owner, who knew how this part of the business worked and expected the answer would be no. That meant reopening decisions that felt locked in and making room in the schedule to change them. Then, together, we won over the business director.
03 Key Decisions
1Let’s test the filters until they work
A colleague’s early test hinted that people struggled to filter their claims, but it tested the filters on their own. I cleaned up the prototype and reran it with clearer tasks, on the side, this time within the whole page. One task asked people to show one family member’s medical claims from the past month. Only 21% managed it, for a usability score (SUM) of 44%.
The reasons surprised me. Most people never saw the “Advanced filters” link at all. Seven of fourteen went to a different drop-down on the page, and about three in four expected the date filters and the advanced filters to work together, which they didn’t. On a long landing page with several sections people can act on, they couldn’t tell what would affect what — something testing the filters alone would never have shown.
So I rebuilt it around a simple principle: there should be one way to do each thing. Every filter moved into one panel behind one Filter button, with the same options. On the same task, 13 of 14 people succeeded, and the usability score rose from 44% to 95%. The first time, people were confidently wrong. The second time, they were confidently correct.
2Let’s put every claim in one table
Completed and in-progress medical claims sat in separate tables, and dental and travel claims each had a table of their own. People had to know what kind of claim they’d made, and where it was in the process, before they could find it. We brought them together into one table for every claim, named by what the claim was for. Drug claims need more back-end work, and they’re on the product team’s roadmap to do next.
Because most visits are to check on something recent, I recommended dropping the 30, 60 and 90-day filters entirely. I proposed showing your five most recent claims and using pagination to provide access to older claims without navigating away. Neither made the release. The business wanted a date filter, so the page launched with the past 30 days applied by default. I pushed back on the default, since a filter people didn’t choose can hide the claim they’re looking for and if someone had a lot of claims, it would push all information further down. However, the default stayed.
3Let’s build for the data we have
Everyone expected batch printing: tick several claims, then download them together. The business, our product owner, and the earlier design all called for it because the old table worked that way. However, the old table was designed more than ten years ago when printing claims made sense. Today, most people download and save them to their computer or phone.
We knew that 400,000 people had clicked “Download & Print” in 13 months, which sounds like a clear need. However, I wasn’t satisfied. When I dug into the data, I learned that the button was untracked and told us nothing about whether they downloaded one claim or twenty at a time (or whether they even finished the flow, which took more clicks). The pushback was always the same: this is how it’s always worked. Nobody could show that it did.
Batch printing meant custom components, more error states and more accessibility work — all for a need we couldn’t measure. I wrote the case for a download icon on each row, built from standard components, with tracking so real use could show whether batch printing was ever worth building. As I put it in the case: “We cannot design an informed batch downloading solution without this data.” It scored 97% on usability and 11 of 12 people said that’s exactly how they’d download more than one claim.
4Let’s give every link a home
The page also had to bring important links forward, so people wouldn’t have to dig through our older pages to find them. But a page full of links would only move the clutter. The links needed to be organized, and the site needed a plan for how they’d thin out over time. I listed every link on the benefits site and asked where each one should live. The two most-used tasks became quick links, chosen by traffic, and placed at the top of the page. Everything else went into a set of tabs with clear categories, validated in our usability testing with people easily finding their way around them.
I designed the tabs to be temporary. The strategy I proposed was that a link only became a quick link if that’s where it belonged for good and had data to back it up. Each link under the tabs could be removed once it found a proper home (like all our FAQs in one searchable help page, or benefit settings under your profile). With the links gathered on the new page, three older pages could be removed entirely because they just listed links. As the links were centralized or their information found new homes, those pages could also go away, shrinking the site a little more each time.
04 Outcomes
- 44%→95%
- on the usability score for filtering claims, before and after the redesign
- 97%
- on the usability score for downloading claims, with one download per row
- +22.4
- points on the usability score for looking up coverage
Compared with the old health pillar, every main task we compared scored better: finding a benefit card (+6.7 points), looking up coverage (+22.4) and reviewing a recent claim (+3.9). The biggest jump came from bringing coverage onto the page itself, with details that open in a panel instead of on old pages deep in the site.
The download shipped with its tracking, and we haven’t seen any issues since launch — even through tax season. The business is happy with the download now that the data shows people using it — and, importantly, no one has complained about the lack of batch printing. Data settled it, not habit.
05 What Came Next
The tabs were the first step in a bigger plan. I recommended retiring seven old pages over the long term, including one linked from 51 places across the site. Those retirements haven’t happened. I was their main advocate, and after I moved on to the Group Investments team, priorities shifted.
I honestly feel bad about that. Looking back, I’d have made the case differently. Putting it in money terms might have helped, but this area had so little data and the pages were so old that it would have been close to impossible. What I could have done was test each of those pages with users to show leaders why they weren’t working and design the retirements in stages rather than leaving a strategy behind. Many of the leaders in this area respond to what they can see, and I’d have given them a lot more to look at, page by page.
The plan is still there when the team is ready. The work that did ship taught me a lot about influence. When people don’t want to change, the evidence has to be clear, and the story simple enough to take to their own leaders. I’m still confident those pages will go away in the long term, thanks to the foundation I set and a new emphasis on accessibility — it’s just a matter of how long-term is long-term.